Spain lifted the trophy in New Jersey this July, beating Argentina 1–0 in extra time. Four years earlier the tournament had been played in Qatar — a country that, in the years leading up to the event, was regularly described in the press as buying reputational cover through sport. Before that, Russia 2018. And before that, most notoriously, Argentina 1978, hosted and won under a military junta that was, at that very moment, disappearing its opponents.1
So here is a political science question: does the type of political regime affect a country’s chances of qualifying for — and winning — the World Cup?
I did not arrive at this through the literature. I arrived at it on the sofa while preparing a summer school class and watching a game. The first thing that came back from a quick web search was a piece in The Conversation by John A. Tures, a political scientist at LaGrange College, published a few weeks before the 2026 tournament: “Does the World Cup favor democratic or autocratic nations? I did some number crunching to find out”. Tures counts regime types among finalists and champions using Polity and Freedom House, and finds democracies heavily over-represented: on his figures roughly seven in ten finalists between 1930 and 2018 were democracies, and from 1974 onwards only two champions were anything other than free — Argentina in 1978 and Brazil in 1994. He reads the pattern as good news for democracies.
That was enough to make me want to dig a bit deeper. Descriptive counts of finalists are a perfectly respectable way to start, but they open even more questions: is it democracy doing the work, or is it wealth, population and the geography of FIFA’s qualification slots, all of which happen to travel with democracy? So I went a bit further with the analysis.
This post walks through the whole thing: the theory, the data, the models, and (importantly) the reasons not to over-read the results. All the code is here, so you can reproduce or improve any of it.
Two competing theories
The interesting thing about this question is that plausible arguments run in both directions.
H1a — the sportwashing hypothesis. Autocracies have an unusually strong incentive to invest in elite sport. A national team is a cheap, legible source of legitimacy at home and of prestige abroad; and an autocratic government can direct resources to a football federation without having to justify the allocation to a parliament, a press or an electorate. If that is the dominant mechanism, less democratic countries should be more likely to qualify and win.
H1b — the democratic capacity hypothesis. Democracies are better at organising the boring, long-run stuff that produces good football teams: youth systems, stable domestic leagues, functioning federations, rule-bound selection of coaches and players rather than selection by patronage. They are also, on average, richer, and wealth buys infrastructure. If that dominates, more democratic countries should be more likely to qualify and win.
Both stories are coherent. That is exactly why we need to look.
Data and operationalisation
Two ingredients.
The dependent variables (Y) come from the FIFA World Cup dataset: one row per team per edition, from Uruguay 1930 to the 2026 tournament in Canada, Mexico and the United States. From it I build three binary outcomes — participated, reached the final, won. I also keep a host-country flag.
The independent variable (X) is democracy, taken from the Varieties
of Democracy project (V-Dem, v14). The headline
measure is the electoral democracy index (v2x_polyarchy), a 0–1
continuous score built on Dahl’s procedural criteria: free, fair and
repeated elections; universal suffrage; the right to run for office;
freedom of expression and alternative sources of information; freedom of
association.
Note what this measure does not do. It is procedural, not substantive: it scores institutions and procedures, not outcomes. A country that delivers good public services autocratically scores low; a messy, unequal democracy scores high. That is a deliberate choice, and a contestable one.
Controls: log GDP per capita, log population, natural resource income per capita, and the host flag.
##   editions team_years      first       last
##         23        537       1930       2026
Three data decisions worth flagging
Before any results, the unglamorous part — because these choices shape what follows.
-
Countries that no longer exist. V-Dem codes Czechoslovakia under Czechia, the USSR under Russia, Yugoslavia and Serbia-Montenegro under Serbia, West Germany under Germany, and Zaire under DR Congo. Reasonable, but it means some historical entities are being scored with a successor state’s country code.
-
The British problem. England, Scotland, Wales and Northern Ireland field separate national teams but are not separate countries in V-Dem. All four map to the United Kingdom. In the participation model a country counts once per edition even when it has several teams entered — otherwise the UK would look like it qualifies at a superhuman rate. Curaçao, a 2026 debutant, is a constituent country of the Kingdom of the Netherlands, not a sovereign state, and simply has no V-Dem data. It stays missing rather than being assigned Dutch institutions.
-
V-Dem stops before the ball does. V-Dem v14 runs to 2023, and several variables end well before that (Freedom House 2021; Polity effectively 2018; GDP and population 2019). For the 2026 edition there is no exact year match at all. Rather than dropping a whole tournament, I carry the last available observation forward, within a maximum of eight years, and keep track of the lag. Set
carry_forward <- FALSEbelow to see the stricter version, in which 2026 disappears from the models.
Part 1 — Who qualifies?
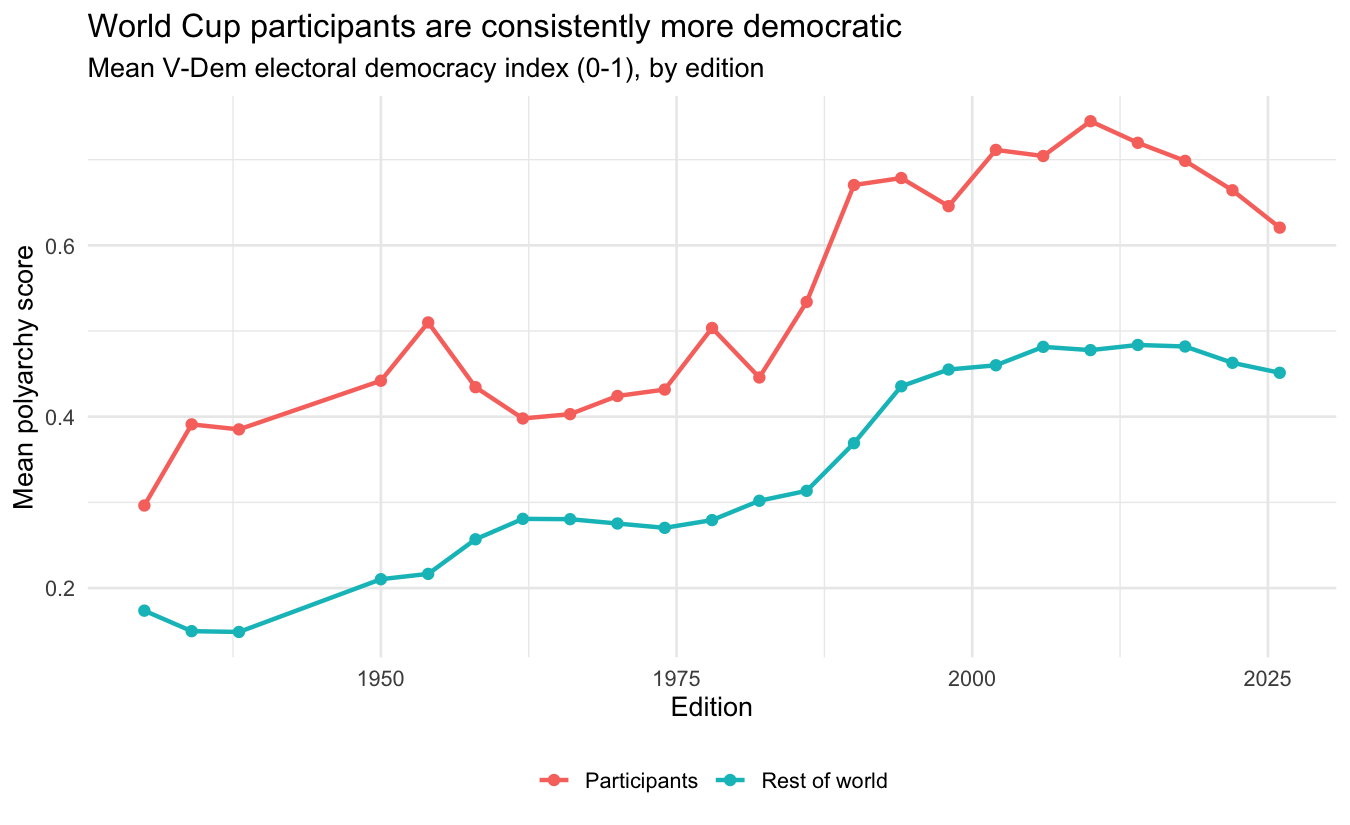
Start with the crudest possible comparison: the average level of democracy among the countries that made it to a given World Cup, against every other country in the world that year.
##            group  mean median     N
##           <char> <num>  <num> <int>
## 1: Rest of world 0.338  0.236  3280
## 2:  Participants 0.585  0.703   524
The gap is 0.247 points on a 0–1 scale — participants average 0.585 against 0.338 for everyone else, with a p-value < 0.001. And the line is above the other line in every single edition since 1930. On the face of it, H1b wins and H1a is dead.
We can say the same thing in the blunter language of regime types, using the conventional Polity thresholds (democracy ≥ 6, autocracy ≤ −6, anocracy in between):
## Key: <group>
##            group Anocracy Autocracy Democracy total
##           <char>    <num>     <num>     <num> <int>
## 1:  Participants     15.8      20.0      64.2   520
## 2: Rest of world     29.3      34.3      36.4  2512
But wait: rich countries are also democratic
The raw gap is not an answer, because democracy is bundled with everything else that helps a country field a good football team. Rich countries are more likely to be democracies and more likely to have professional leagues. Big countries have more players to choose from. And qualification slots have never been distributed by merit alone — Europe and South America have always been over-represented relative to their share of the world’s countries, and Europe and South America are also where the old democracies are.
So: a logit for the probability of qualifying, with year fixed effects (each edition compared only against itself, which absorbs the changing number of slots), controls for wealth and population, and standard errors clustered by country.
##             term estimate    se     p    OR
##           <char>    <num> <num> <num> <num>
## 1: v2x_polyarchy    1.250 0.419 0.003  3.49
## 2:     log_gdppc    0.808 0.131 0.000  2.24
## 3:       log_pop    0.606 0.099 0.000  1.83
Democracy survives, but it is no longer the star of the show. The polyarchy coefficient is 1.25 in log-odds (p = 0.003) — positive, but sitting alongside a coefficient of 0.81 on log GDP per capita and 0.61 on log population. Since polyarchy runs from 0 to 1, that coefficient is the effect of moving from North Korea to Norway, which is about as large a shift as the variable allows; the wealth and size coefficients are per log point and accumulate fast.
The honest summary of Part 1: participants really are more democratic than the world average, but much of that reflects being rich and populous, which is correlated with being democratic for reasons that have nothing to do with football.
Part 2 — Who wins?
Now condition on having qualified. Among the countries actually at the tournament, do the democracies go further?
##      year         team polyarchy polity2    regime  host
##     <int>       <char>     <num>   <int>    <char> <int>
##  1:  1930      Uruguay      0.56       3  Anocracy     1
##  2:  1934        Italy      0.06      -9 Autocracy     1
##  3:  1938        Italy      0.06      -9 Autocracy     0
##  4:  1950      Uruguay      0.79       0  Anocracy     0
##  5:  1954 West Germany      0.84      10 Democracy     0
##  6:  1958       Brazil      0.40       6 Democracy     0
##  7:  1962       Brazil      0.41       5  Anocracy     0
##  8:  1966      England      0.83      10 Democracy     1
##  9:  1970       Brazil      0.18      -9 Autocracy     0
## 10:  1974 West Germany      0.86      10 Democracy     1
## 11:  1978    Argentina      0.07      -9 Autocracy     1
## 12:  1982        Italy      0.81      10 Democracy     0
## 13:  1986    Argentina      0.83       8 Democracy     0
## 14:  1990 West Germany      0.90      10 Democracy     0
## 15:  1994       Brazil      0.84       8 Democracy     0
## 16:  1998       France      0.88      10 Democracy     1
## 17:  2002       Brazil      0.86       8 Democracy     0
## 18:  2006        Italy      0.86      10 Democracy     0
## 19:  2010        Spain      0.89      10 Democracy     0
## 20:  2014      Germany      0.89      10 Democracy     0
## 21:  2018       France      0.88      10 Democracy     0
## 22:  2022    Argentina      0.84       9 Democracy     0
## 23:  2026        Spain      0.84      10 Democracy     0
##      year         team polyarchy polity2    regime  host
##     <int>       <char>     <num>   <int>    <char> <int>
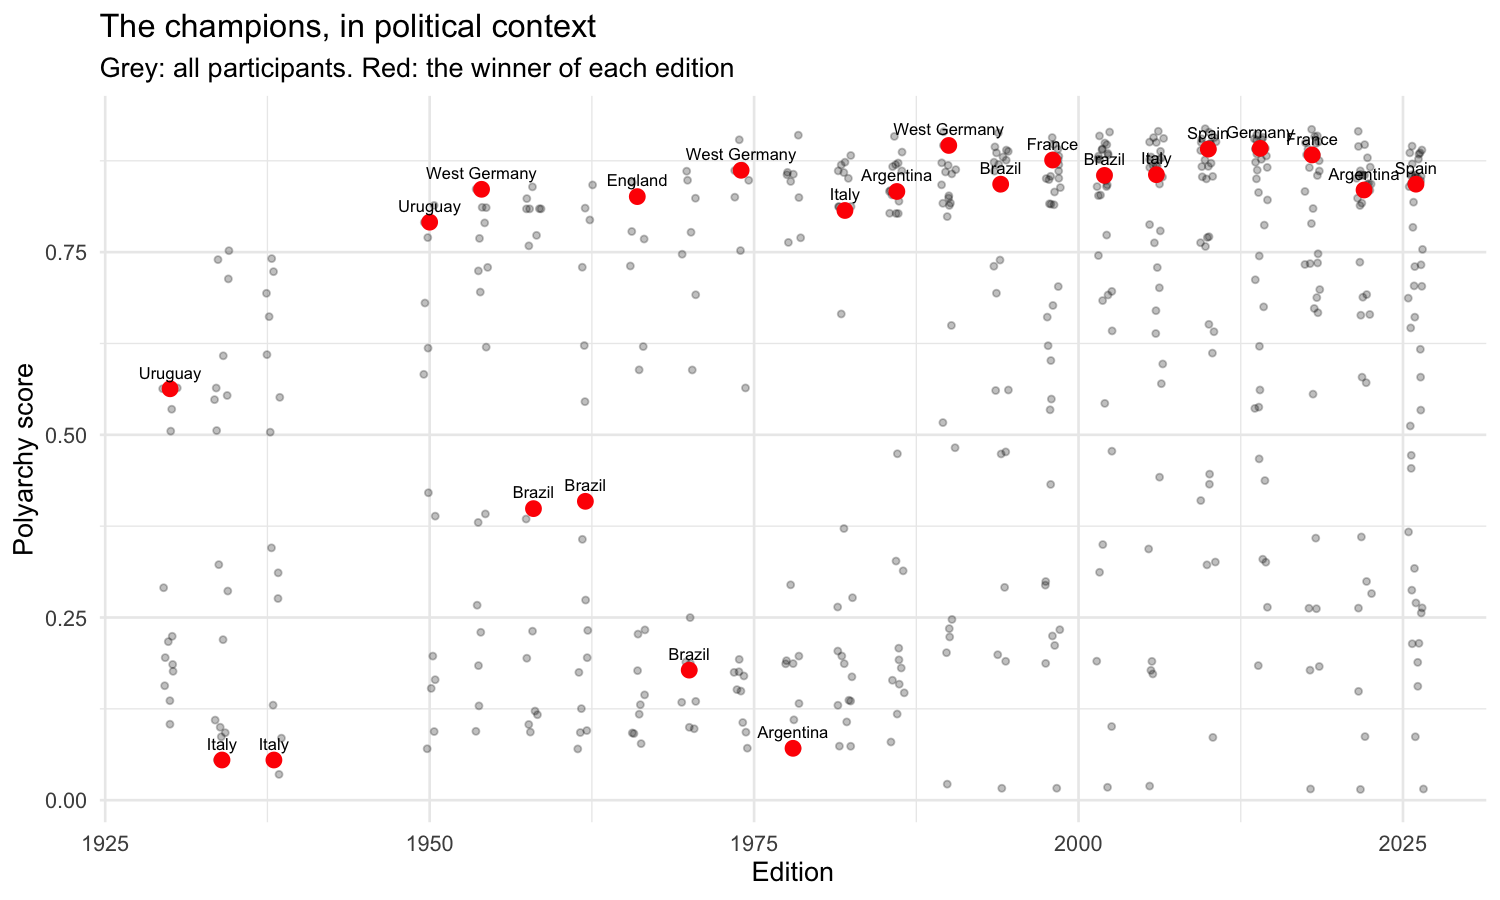
The champions list is where the sportwashing intuition gets its oxygen. Italy 1934 and 1938 under Mussolini. Brazil 1970 under the military dictatorship. Argentina 1978, hosting and winning under the junta. Those are the visually striking cases in the plot below — the red dots down at the bottom.
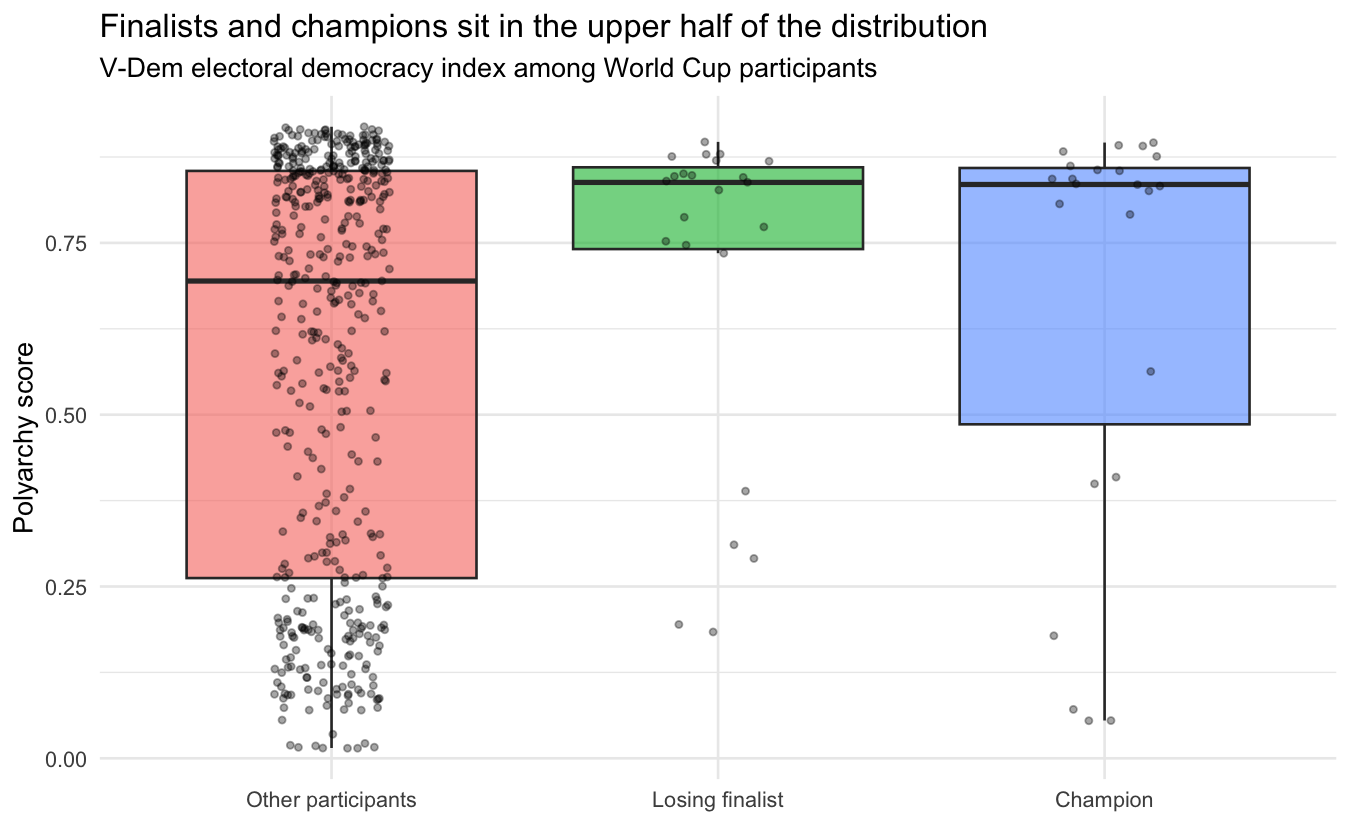
##               outcome mean_polyarchy     N
##                <fctr>          <num> <int>
## 1:    Losing finalist          0.710    23
## 2:           Champion          0.668    23
## 3: Other participants          0.581   490

##            Champion
## Regime        0   1
##   Anocracy   79   3
##   Autocracy 100   4
##   Democracy 330  16

## [1] 1
Champions average 0.081 points more polyarchy than the other participants (p = 0.224). But look at the boxplot again: the champion box is wide. A handful of authoritarian winners drag the lower whisker a long way down, and with only 23 champions in the whole history of the tournament, a couple of cases move everything.
Models for winning and reaching the final
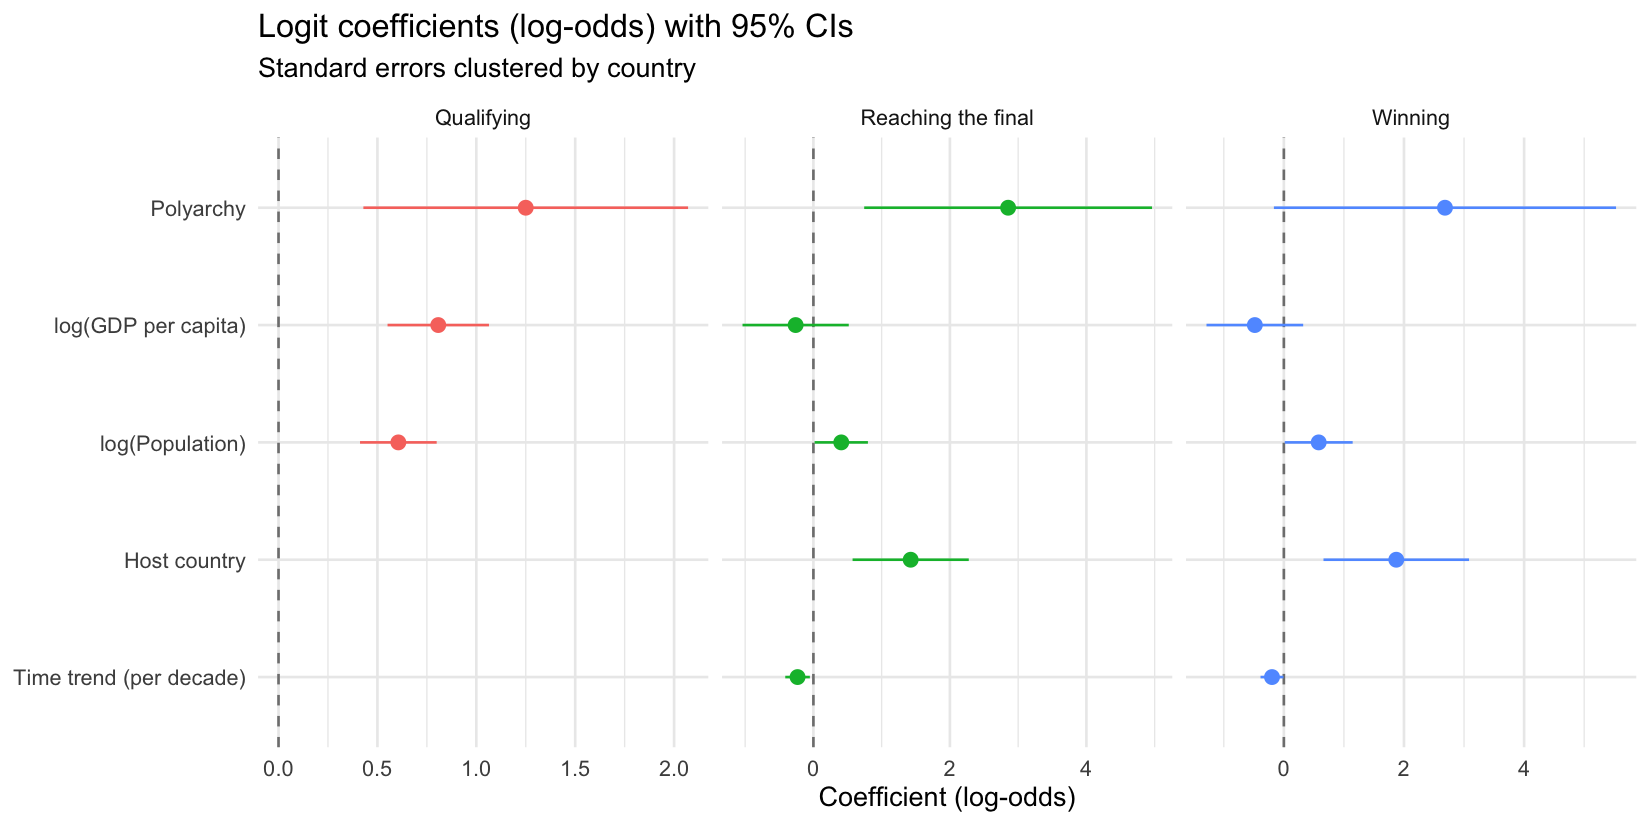
Here we hit a hard statistical constraint. One champion per edition means very few events. Year fixed effects would produce perfect separation, so I use a linear time trend instead and keep the control set short. These estimates are indicative, not conclusive — the confidence intervals will make that obvious.
##        model          term estimate    se     p
##       <char>        <char>    <num> <num> <num>
##  1: Champion v2x_polyarchy    2.682 1.453 0.065
##  2: Champion     log_gdppc   -0.483 0.411 0.239
##  3: Champion       log_pop    0.580 0.289 0.044
##  4: Champion          host    1.871 0.618 0.002
##  5: Champion        year_c   -0.198 0.098 0.043
##  6: Finalist v2x_polyarchy    2.853 1.076 0.008
##  7: Finalist     log_gdppc   -0.260 0.397 0.512
##  8: Finalist       log_pop    0.408 0.199 0.041
##  9: Finalist          host    1.425 0.434 0.001
## 10: Finalist        year_c   -0.232 0.092 0.011
Three things stand out.
Democracy predicts reaching the final more clearly than winning it. The polyarchy coefficient is 2.85 for the final (p = 0.008) and 2.68 for the title (p = 0.065). Same sign, similar size, but the confidence interval for winning is enormous. That makes sense: reaching the final is a slightly less random event than winning it, and there are twice as many finalists as champions to learn from.
Wealth stops mattering once you have qualified. GDP per capita is a strong predictor of getting to the tournament and essentially useless for predicting what happens there. The rich-country advantage is spent at the qualification stage.
Hosting is the biggest effect in the table. The host coefficient for winning is 1.87 in log-odds, an odds ratio of about 6.5. Home advantage in football is real, well-documented, and much larger than anything political here.
Robustness: does the measure drive the result?
v2x_polyarchy is one operationalisation among several. Here are three,
standardised so the coefficients are directly comparable — each is the
effect of a one-standard-deviation increase in democracy:
- Polyarchy (V-Dem electoral democracy index)
- Additive polyarchy (
v2x_api, same components, additive rather than multiplicative aggregation) - Freedom House, averaging political rights and civil liberties, reversed so that higher means more democratic. Only available from 1974.
##               outcome                    measure estimate    se     p
##                <fctr>                     <fctr>    <num> <num> <num>
## 1:         Qualifying          Polyarchy (V-Dem)    0.359 0.120 0.003
## 2: Reaching the final          Polyarchy (V-Dem)    0.856 0.323 0.008
## 3:            Winning          Polyarchy (V-Dem)    0.805 0.436 0.065
## 4:         Qualifying Additive polyarchy (V-Dem)    0.359 0.126 0.004
## 5: Reaching the final Additive polyarchy (V-Dem)    0.606 0.321 0.059
## 6:            Winning Additive polyarchy (V-Dem)    0.458 0.428 0.284
## 7:         Qualifying  Freedom House (from 1974)    0.431 0.141 0.002
## 8: Reaching the final  Freedom House (from 1974)    1.081 0.284 0.000
## 9:            Winning  Freedom House (from 1974)    1.016 0.411 0.013
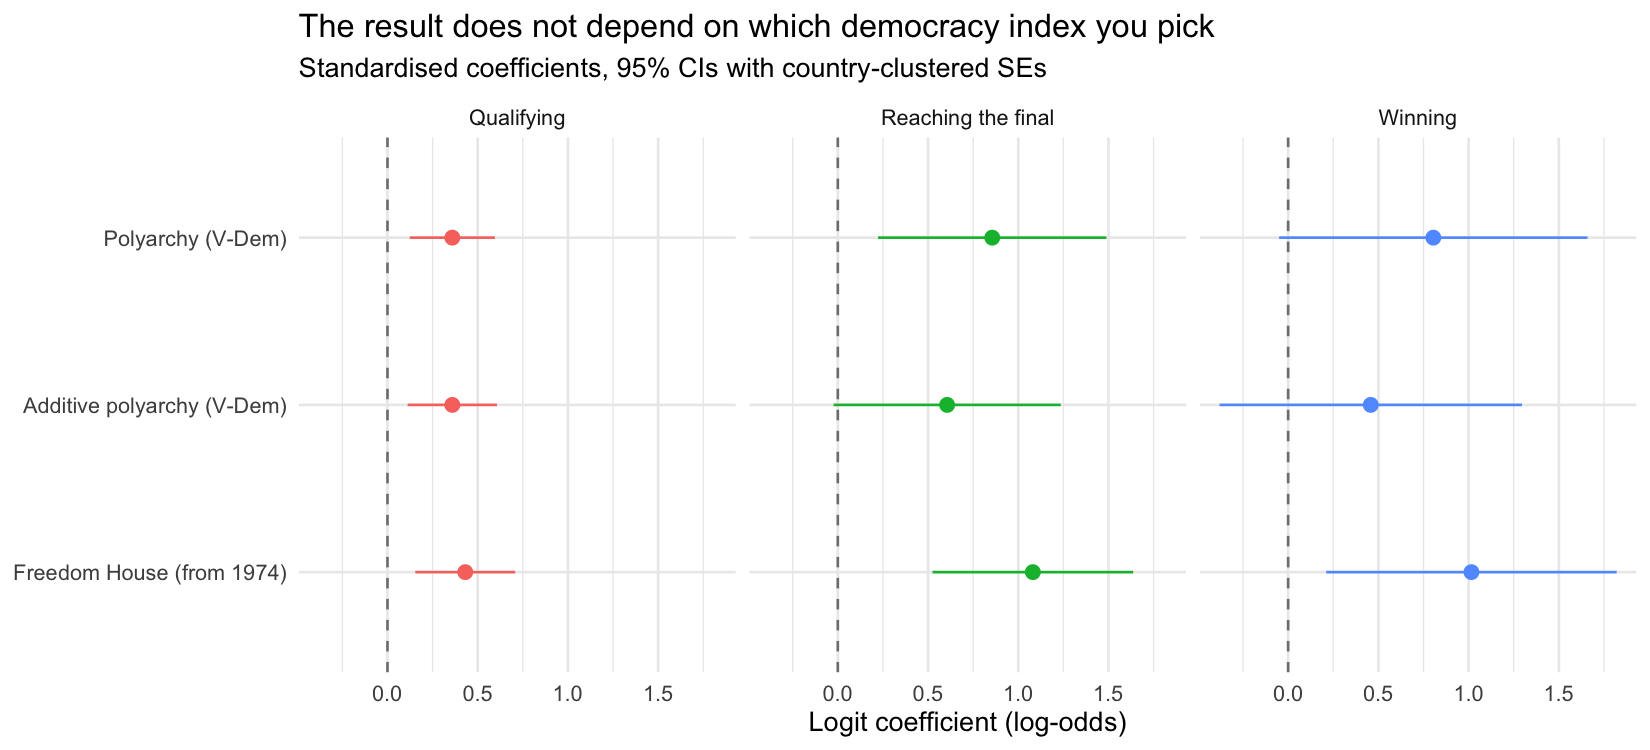
All three measures point the same way, and all three reproduce the same pattern: a modest effect on qualifying, a larger one on reaching the final, and a large but very imprecise one on winning. Freedom House gives the strongest coefficients, but it covers only 1974 onwards — a period in which the world democratised substantially and football professionalised globally, so a shorter window is not a neutral choice.
What this does and does not show
Statistics can establish association. It cannot, by itself, establish causation, which additionally requires temporal precedence and the absence of confounding. The second condition is the one that should worry us here.
Confounding is everywhere. Democracy, wealth, European or South American geography, colonial history and the age of a country’s football federation all travel together. Adding GDP and population as controls handles some of that crudely; it does not handle the fact that FIFA’s qualification slots have historically favoured exactly the regions where democracy is oldest.
Measurement across a century is heroic. We are applying a single democracy index to Uruguay in 1930 and to Canada in 2026. V-Dem does this carefully, but comparisons across such different worlds carry real uncertainty.
Very few events. Twenty-three champions is not a large sample by any standard. With a slightly different specification, the winning model will change its mind.
Nothing here refutes sportwashing. The theory is about investment and intent, not about winning percentages. An autocracy can pour resources into football, host a spectacular tournament, gain everything it wanted reputationally, and still lose in the round of 16. Testing sportwashing properly requires measuring the money and the propaganda, not the trophies.
The takeaway
Across ninety-six years and twenty-three tournaments, World Cup participants have been more democratic than the world average in every single edition, and finalists more democratic than the average participant. The hypothesis that autocracy is an advantage on the pitch — H1a — finds no support.
But the version of H1b that survives is a modest one. Most of the participation gap is explained by wealth and population, not democracy as such. Among qualified teams, the clearest political predictor of success is not the regime type: it is playing at home. The descriptive pattern that Tures reports is real and I reproduce it; what shrinks once you add controls is how much of it democracy can claim for itself.
So the theory has not been falsified. That is a weaker claim than “the theory has been proved”, and it is the strongest thing the evidence supports. Which is, more or less, always where honest quantitative social science ends up.
Data: FIFA World Cup dataset; V-Dem v14 (Coppedge et al., Varieties of Democracy Project). The V-Dem release is far too large to redistribute here, so what I share is the analysis file actually used below — one row per country-year, with only the variables that enter the models — together with the R Markdown source that builds it and runs every model reported above. Both are on GitHub. The raw V-Dem dataset can be downloaded directly from v-dem.net. Comments, corrections and better specifications very welcome.
-
On that last case, see Scharpf, Gläßel and Edwards (2023), “International Sports Events and Repression in Autocracies: Evidence from the 1978 FIFA World Cup”, American Political Science Review 117(3). ↩