On 25 February 2026, the Luiss campus in Viale Romania hosted the roundtable Political Trust and Distrust in France and Italy, organised by the Luiss Department of Political Science, CISE and the BNP-BNL Paribas Chair in French and Italian Relations in Europe.
The occasion was the presentation of the 17th wave of the Political Trust Barometer (Baromètre de la confiance politique), the annual survey run by CEVIPOF–Sciences Po since 2009. This year’s wave was fielded online by OpinionWay between January and February 2026 in five countries: France (3,166 registered voters), Germany (1,814 respondents), Italy (1,810), the United Kingdom (1,800) and Romania (1,723).
Lorenzo De Sio, director of CISE, chaired the session, and Marc Lazar, who holds the BNP-BNL Paribas Chair, introduced it. Bruno Cautrès (CEVIPOF–Sciences Po) presented the main results of the Barometer, with a focus on France. The picture he drew is bleak: French respondents describe their state of mind above all with distrust and weariness (45 per cent each), while only one in ten chooses confidence. Chiara Fiorelli (Sapienza University of Rome) was the discussant.
My contribution was a set of additional observations on the Barometer, comparing France and Italy with regression models on the individual-level data. This post summarises them.
What political trust is and why it matters
Following Easton (1975), political trust can be thought of as citizens’ reservoir of goodwill towards the actors and institutions of democratic governance. It has been declining in several large, established democracies, and low trust is often seen as eroding the quality of democracy: it favours challengers at the extremes and may depress participation. At the same time, most citizens of democratic countries remain committed to democracy as a system of government. The problem is less with democracy as an idea than with the goodwill extended to those who run it.
Trust in 2026: France at the bottom
The headline figure is striking. Asked whether, in general, they trust politics, only 22 per cent of French respondents say yes, down four points on the previous year. Italy (40 per cent), Germany (45 per cent) and the United Kingdom (44 per cent) cluster together, well above France.
| “In general, do you trust politics?” | France | Germany | Italy | UK |
|---|---|---|---|---|
| Yes (total) | 22% (−4) | 45% (−2) | 40% (+1) | 44% |
| Yes, completely | 4% | 11% | 9% | 10% |
| Yes, somewhat | 18% | 34% | 31% | 34% |
| No (total) | 78% (+4) | 55% (+2) | 60% (−1) | 56% |
| Rather not | 50% | 40% | 45% | 43% |
| Not at all | 28% | 15% | 15% | 13% |
Table 1. Trust in politics, January 2026. Changes in percentage points on the previous wave (February 2025) in brackets. Source: CEVIPOF–OpinionWay, Political Trust Barometer, wave 17.
Who trusts? Social position first
The comparison between France and Italy starts from a simple question: who are the citizens who still trust politics? Figure 1 reports the predictors of political trust in the two countries.
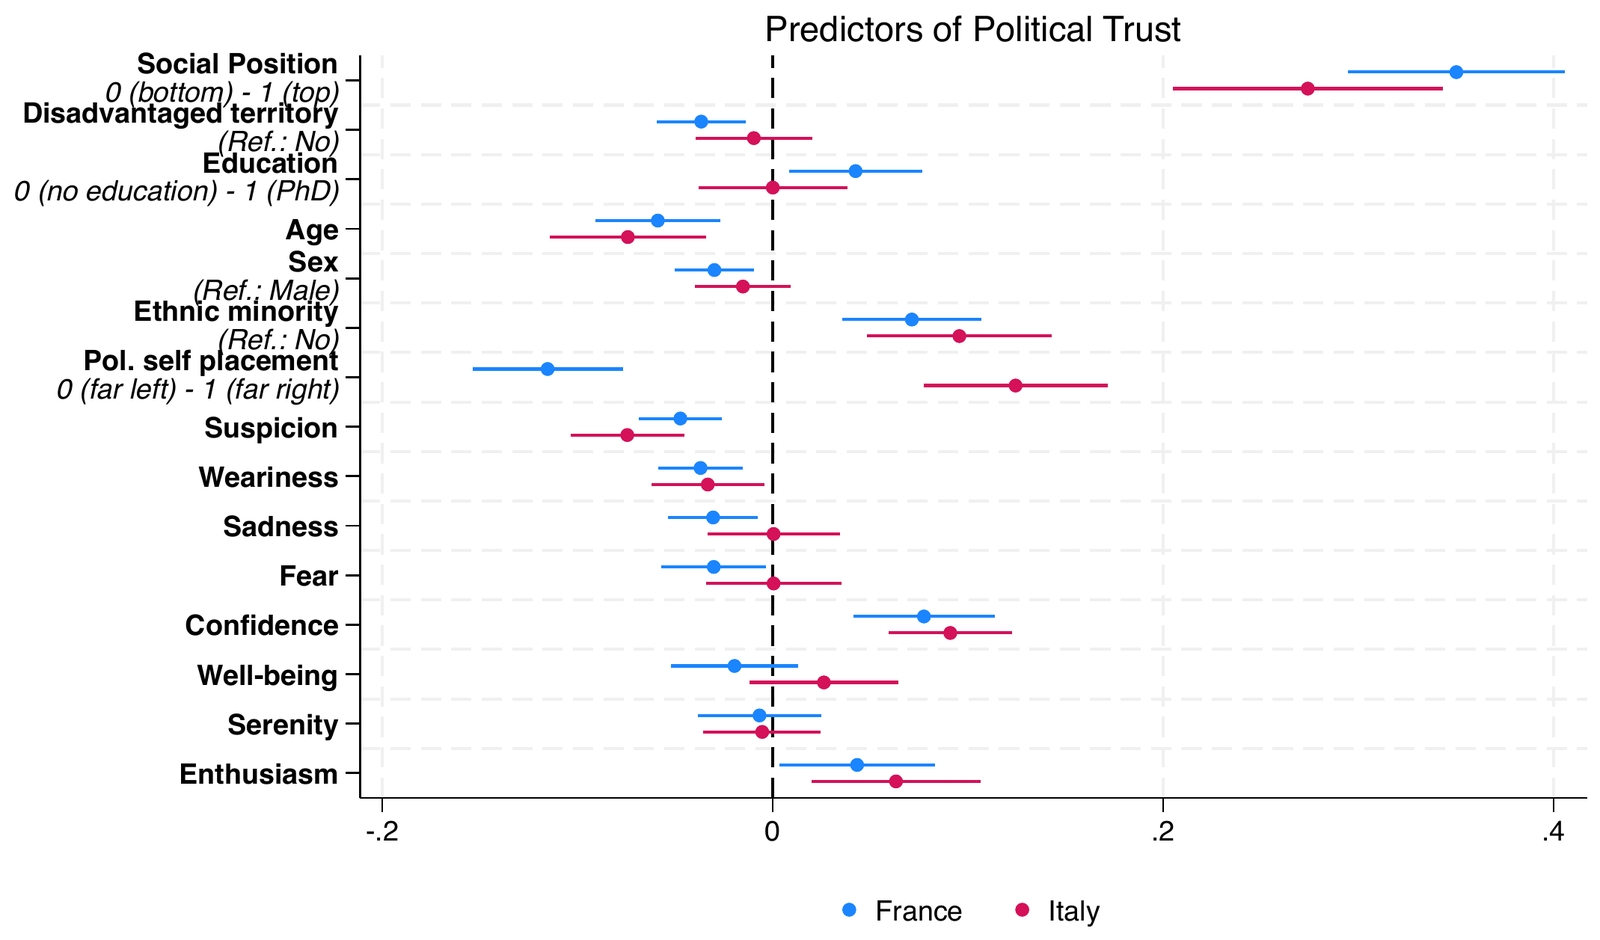
Figure 1. Predictors of political trust in France (blue) and Italy (red). Point estimates with confidence intervals; continuous predictors are scaled from 0 to 1.
Four patterns stand out.
- Social position is by far the strongest predictor in both countries. Respondents who place themselves at the top of the social ladder trust politics much more than those at the bottom.
- Structural factors matter more in France. Education, age, sex and living in a disadvantaged territory all shape trust among French respondents, while in Italy only age has a clear (negative) effect.
- Political cues work in opposite directions. In France, respondents further to the right trust politics less, while in Italy they trust it more. The same ideological position produces opposite attitudes depending on the national political context.
- Emotions matter. Suspicion and weariness go with lower trust in both countries, and sadness and fear do so in France. Confidence and enthusiasm go with higher trust.
Trust is also a matter of perceived intergenerational mobility. Respondents were asked to compare their situation with that of their parents at the same age, on a scale from 0 (worse) to 10 (better). In both countries, those who feel they have done worse than their parents trust politics less, and those who feel they have done better trust it more.
| Average political trust (0–1) | Below parents’ position | Country average | Above parents’ position |
|---|---|---|---|
| France | 0.28 | 0.34 | 0.37 |
| Italy | 0.35 | 0.44 | 0.50 |
Table 2. Average political trust by perceived intergenerational mobility.
Public mood follows the same lines
The same pattern appears for positive public mood, that is, the positive feelings respondents associate with their current state of mind (Figure 2). Social position and the ease with which people make ends meet are the strongest positive predictors. In France, older and more educated respondents, as well as those living in disadvantaged areas, report a less positive mood. Political cues are again inverted between the two countries.
There is also a new element: artificial intelligence as a social risk. Respondents who see AI as a risk for employment rather than an opportunity report a less positive mood, in France and in Italy alike.
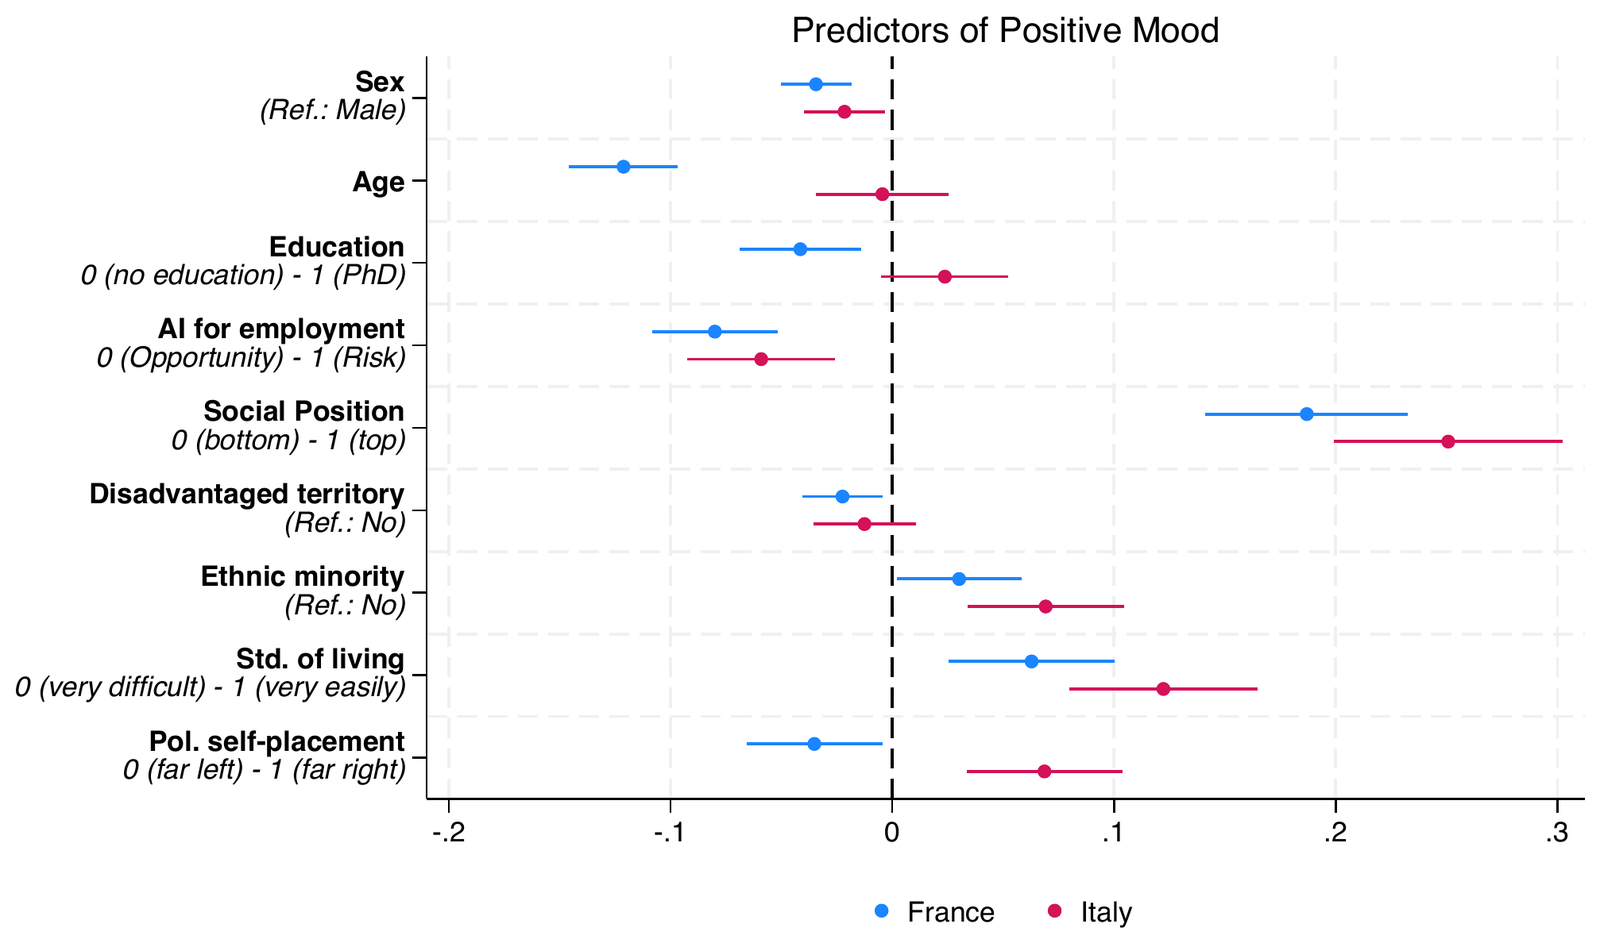
Figure 2. Predictors of positive public mood in France (blue) and Italy (red).
Political equality: do leaders care about people like me?
Trust is only one side of political support. The other is external political efficacy: the belief that the political system and its authorities respond to people like you. In practice, it means feeling that politicians listen, that institutions care what citizens think, and that participation can make a difference. A long tradition in political theory, from Schattschneider to Dahl, warns that inequality in economic resources can translate into inequality in political resources, and then into unequal representation and responsiveness.
The Barometer measures this directly, and the numbers are even lower than those on trust. Only 12 per cent of French respondents think political leaders care a lot or somewhat about what people like them think, and more than half (51 per cent) say they do not care at all. Italy stands at 27 per cent, up four points on 2025, between France and Germany (41 per cent).
| “Do political leaders care about what people like you think?” | France | Germany | Italy | UK |
|---|---|---|---|---|
| Yes (total) | 12% (−5) | 41% (+1) | 27% (+4) | 31% (+5) |
| A lot | 2% | 7% | 5% | 7% |
| Somewhat | 10% | 34% | 22% | 24% |
| No (total) | 87% (+4) | 58% (−1) | 73% (−4) | 69% (−2) |
| A little | 36% | 33% | 37% | 40% |
| Not at all | 51% | 25% | 36% | 29% |
Table 3. External political efficacy, January 2026. Changes on the previous wave in brackets (for the UK, on February 2023).
The predictors of external efficacy overlap almost perfectly with those of trust (Figure 3). Social position is again the dominant factor, even more clearly than for trust. Older respondents feel less listened to, and ideology again cuts in opposite directions: in Italy, right-wing respondents feel much more listened to, while in France they feel slightly less so.
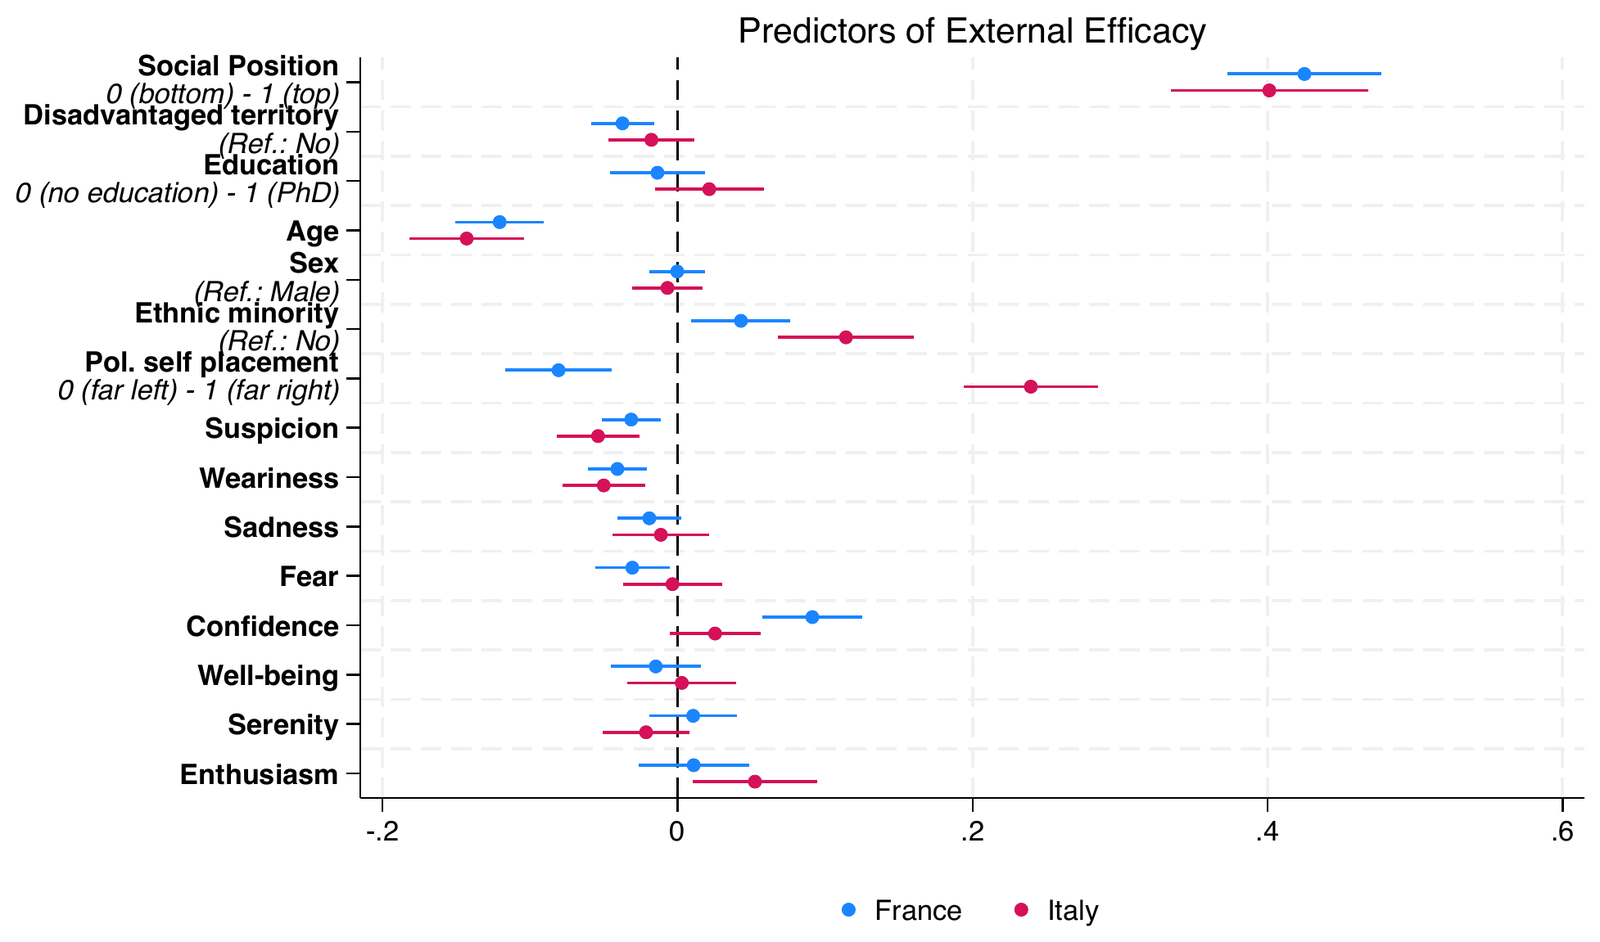
Figure 3. Predictors of external political efficacy in France (blue) and Italy (red).
Who holds the real power?
If politicians do not listen, who does hold power? Asked where the real power lies, Italians point to financial markets more than anyone else (36 per cent, up four points), well ahead of France (29 per cent), Germany (20 per cent) and the UK (21 per cent). Only 8 per cent of Italians think power lies with citizens, the lowest figure in the four countries. The French are more likely to name Europe (23 per cent, up five points). Italy also stands out for the share naming judges (10 per cent, against 3 to 5 per cent elsewhere), a detail worth noting a few weeks before the constitutional referendum on the judiciary.
| “Where is the real power?” | France | Germany | Italy | UK |
|---|---|---|---|---|
| Financial markets | 29% | 20% | 36% | 21% |
| Europe | 23% | 18% | 13% | 10% |
| Citizens | 14% | 10% | 8% | 12% |
| Large private companies | 12% | 18% | 10% | 21% |
| Big Tech (Google, Apple, Facebook, Amazon, Microsoft) | 10% | 19% | 13% | 12% |
| Judges | 4% | 3% | 10% | 5% |
| Social media | 2% | 4% | 3% | 4% |
| Local authorities | 2% | 3% | 3% | 6% |
| Other | 3% | 4% | 3% | 7% |
Table 4. Perceived location of real power, January 2026.
Consequences: who should solve problems, the EU or the national government?
Low trust also has consequences for what citizens expect from institutions. Asked whether, to solve their country’s problems, more power should go to the European Union or to the national government (from 0, the EU, to 10, the national government), clear majorities in all three EU countries lean towards their national government: 62 per cent in France, 58 per cent in Germany and 59 per cent in Italy. Italy has the largest pro-EU minority (18 per cent) and the lowest average score (6.4, against 7.3 in France).
| More power to… | France | Germany | Italy |
|---|---|---|---|
| The EU (0–4) | 9% | 13% | 18% |
| Neutral (5) | 10% | 13% | 10% |
| The national government (6–10) | 62% | 58% | 59% |
| Don’t know | 19% | 16% | 13% |
| Mean (0–10) | 7.3 | 6.6 | 6.4 |
Table 5. Preferred level of government to solve the country’s problems, January 2026 (question not asked in the UK).
The determinants of this preference (Figure 4) reveal another inverted association. In France, citizens who trust politics more and who are better off socially lean towards the EU. In Italy, higher trust and higher social position go with a preference for the national government. Left–right self-placement works consistently in both countries, with right-wing respondents much more favourable to the national level, and structural factors (age, education, sex) again matter more in France.
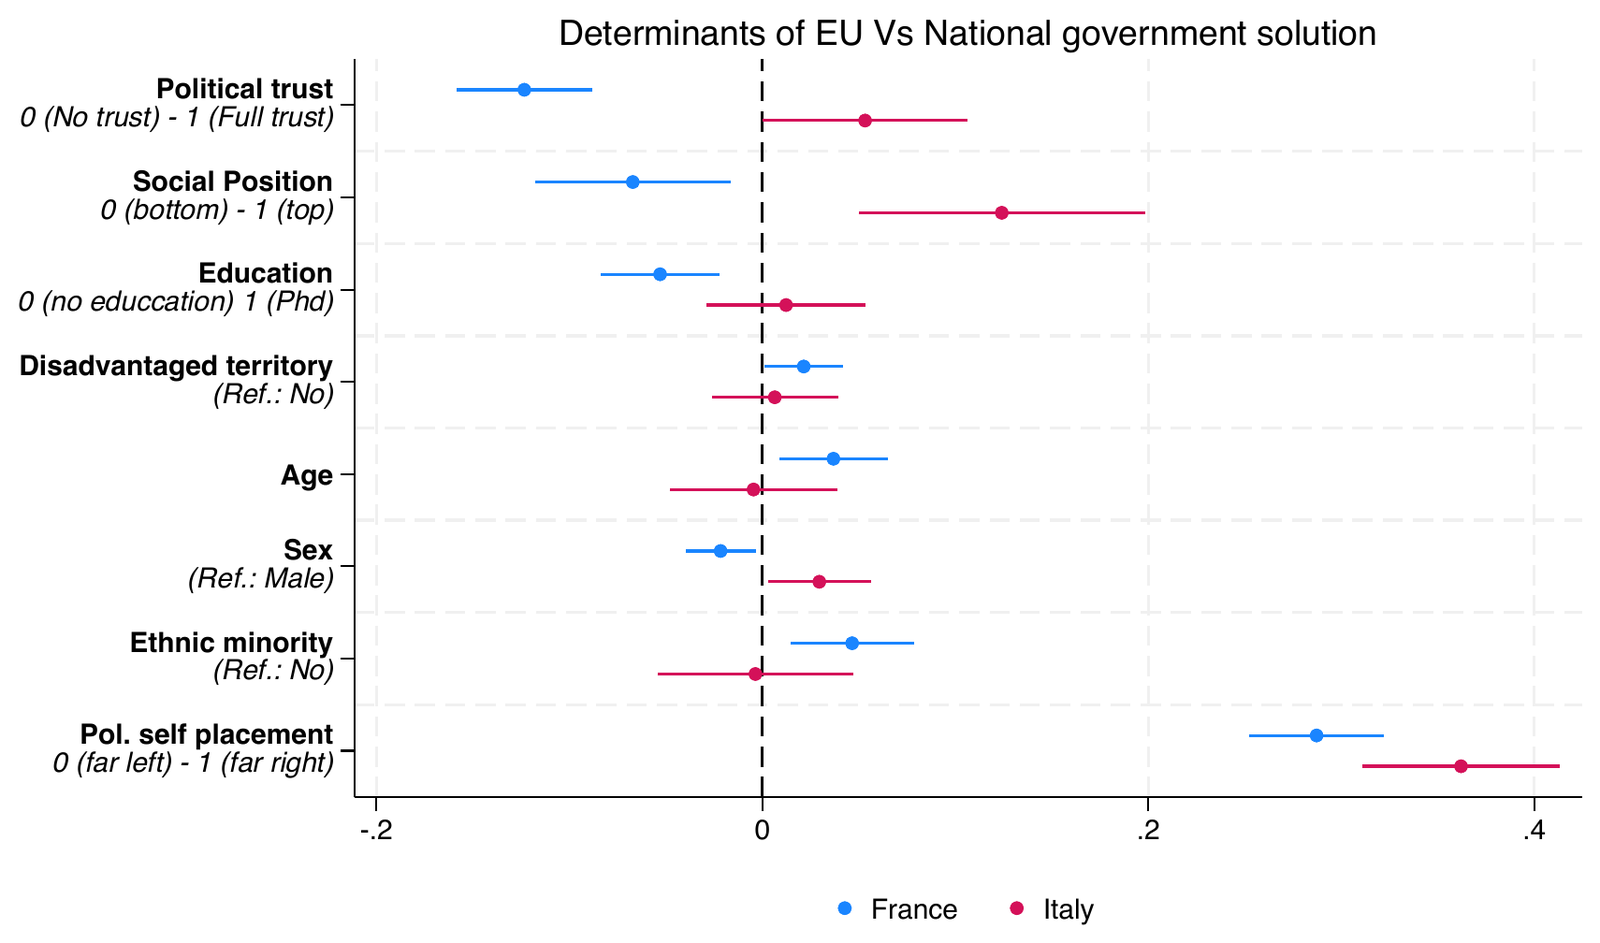
Figure 4. Determinants of the preference for giving more power to the national government rather than the EU (0 = EU, 10 = national government), France (blue) and Italy (red).
Concluding remarks
- Trust and external efficacy are low, and they are socially structured. They depend on social position, perceived intergenerational mobility and economic insecurity, filtered through political cues. The fact that the same cues work in opposite directions in France and Italy suggests that cross-country differences may have more to do with agency (political actors and the political cycle) than with institutions.
- Political support is not just about trust. More attention should go to the fairness of political processes and to responsiveness.
- Citizens demand solutions as much as, if not more than, before, but the capacity to deliver is constrained. Low legitimacy reduces support for state intervention, and interdependencies (EU rules, financial markets, global shocks) limit governments’ room to act.
The open question for democracies is whether this is a passing storm or a systemic rupture.